การอ่านกราฟของสมรรถถนะของปั๊มแรงเหวี่ยง
สมรรถนะของปั๊มแรงเหวี่ยง (Centrifugal pump) ขึ้นกับปัจจัย (Factors) ต่างๆคือ ความดัน (Pressure) ปริมาณการไหล (Flow) พลังงานที่ใช้ (Power) ประสิทธิภาพ (Efficiency) NPSH (Net positive suction head) นำ้หนักจำเพาะ (Specific gravity) ความหนืด (Viscosity) การออกแบบ(Design) ของปั๊ม (Casing, impeller,..etc.) เพื่อให้เหมาะสมกับการใช้งาน (Application)
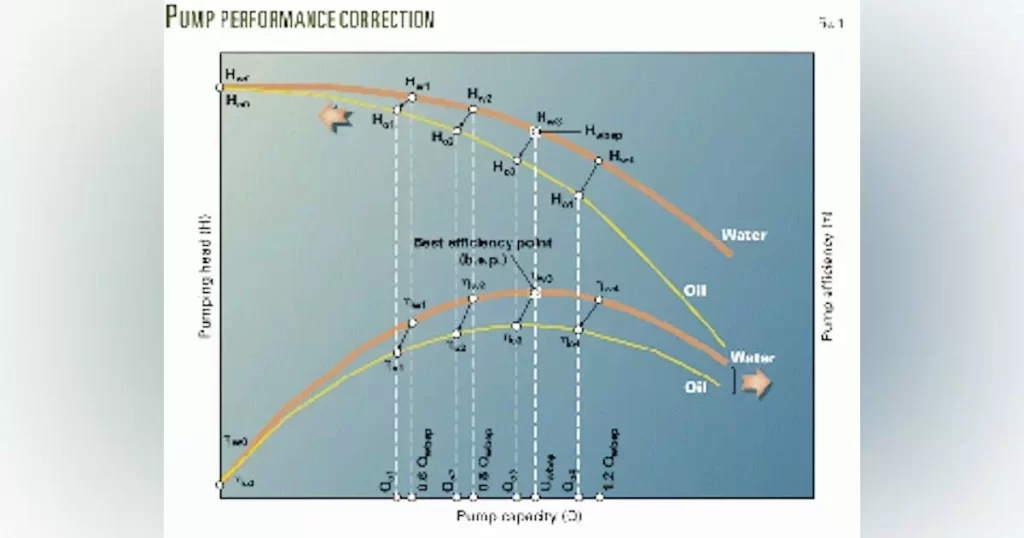
ปั๊มที่ของใหลที่มีความถ่วงจำเพาะ (Specific gravity) ต่างกัน ก็จะมีกราฟสมรรถนะไม่เหมือนกัน ปั๊มที่ใช้งานที่แฟคเตอร์ (Factors) ต่างๆกัน จะให้สมรรถนะที่ต่างกันออกไป
การเลือกใช้ปั๊มนอกจากเลือกชนิดให้เหมาะกับการใช้งานแล้ว จะต้องเลือกปั๊มที่มีประสิทธิภาพสูงด้วย เพื่อการประหยัดพลังงานในการเดินเครื่อง ปั๊มแต่ละชนิด แต่ละแบบ แต่ละโมเดล จะมีชุดของกราฟแสดงสมรรถนะที่ต่างกัน กราฟจะแสดงข้อจำกัดในการใช้งานของปั๊มนั้นๆด้วย
กราฟสมรรถนะนี้ทางโรงงานผู้ผลิดจะทำการทดสอบก่อนจัดส่งให้ผู้ใช้งาน ซึ่งแต่ละโรงงานก็ผลิตได้สมรรถนะได้ไม่เหมือนกัน การใช้พลังงานก็ไม่เท่ากัน ข้อจำกัดในการใช้งานไม่เหมือนกัน ซึ่งจะมีผลต่อการลงทุน ค่าใช้จ่ายในการใช้งาน ค่าใช้จ่ายในการใช้พลังงาน
ขัอดี ข้อเสีย และข้อจำกัดของปั๊มแต่ละชนิด จะมีการกล่าวถึงในการเลือกใช้ปั๊มชนิดต่างๆ การเรียนรู้การอ่านกราฟสมรรถนะของปั๊มแบบแรงเหวี่ยงจะช่วยในการเลือกชนิด และขนาดของปั๊ม และเข้าใจข้อจำกัดในการใช้งานของปั๊ม
กราฟแสดงสมรรถนะของปั๊มแรงเหวี่ยง
What is a Centrifugal Pump Curve?
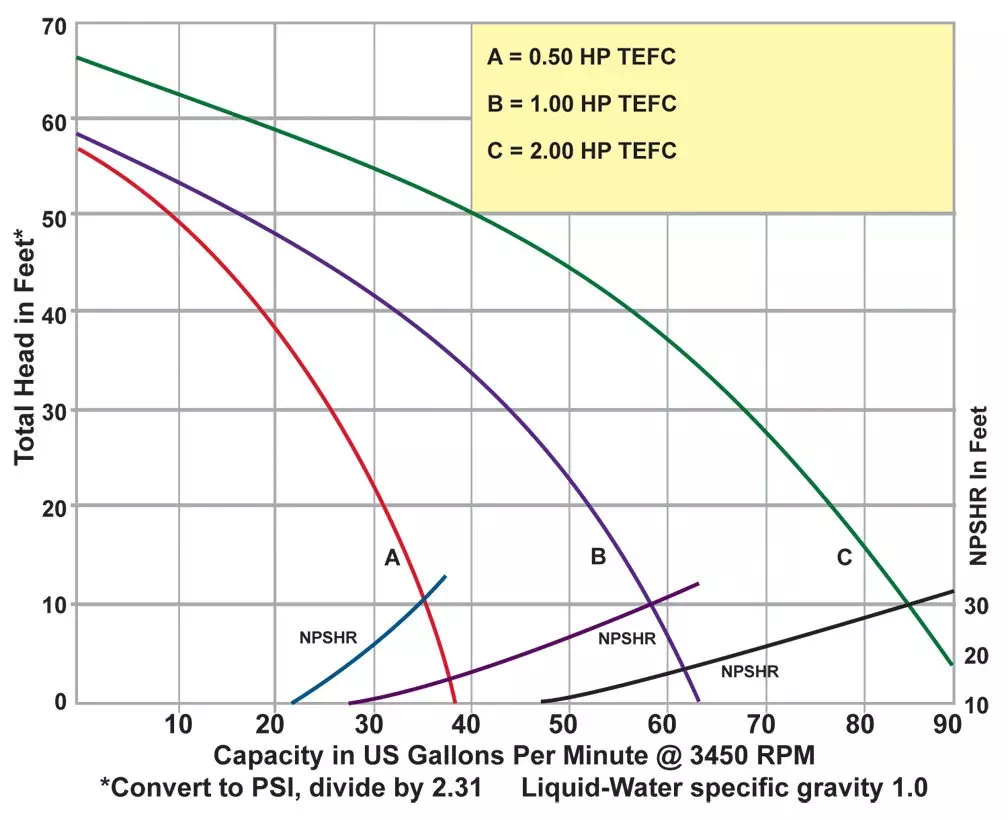
A pump curve is a graphical representation of a centrifugal pump‘s performance characteristics. It shows the relationship between the flow rate (Q), head (H), and power consumption (P) of a pump at different operating points. The pump curve is generated by testing the pump in a laboratory and plotting the data on a graph.
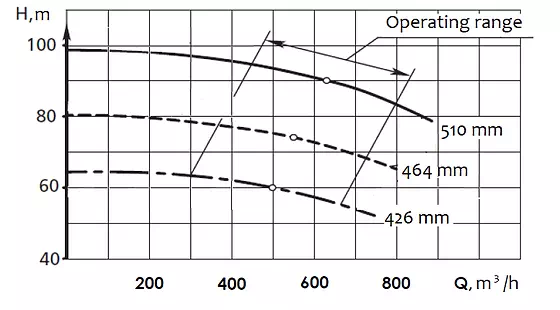
In short, a pump curve is a graphical representation of a pump’s performance based on testing conducted by the manufacturer. Each pump will has its own pump performance curve and it varies from pump to pump. This is based on the pump horsepower and the size and shape of the impeller.
ทำไมต้องใช้กราฟสมรรถนะของปั๊ม
Why Use A Pump Curve?
Understanding any given pump’s performance curve enables you to understand the limitation of that pump. Operating above its given range will not only damage the pump, it will also cause unneeded downtime.
ความสัมพันธ์ของการใหลและความดันของปั๊ม
Flow Rate and Head
The flow rate and head are the two primary parameters that define a pump’s performance. Flow rate is the volume of fluid that the pump can deliver per unit time, typically expressed in gallons per minute (gpm) or liters per minute (lpm). Head is the height to which the pump can lift the fluid, typically measured in feet or meters. The pump’s head is directly proportional to its impeller’s rotational speed and diameter.
อัตราการใหล
Flow
Flow is the rate that the liquid has to be moved throughout a system.
In SI units, it’s measured in litre per minute (lpm) or metre per hour (m3/h). In English Engineering units (used in the United States), it’s measured in gallon per minute (gpm). Different liquid has different viscosity, so be sure to understand their flow. Let’s take a residential water heating system as an example. Too much flow results in system noise, while too little flow means insufficient heat in some areas.
ความดันขาออก
Head
Pressure is measured in PSI, pound per square inch but in hydronic, pressure is calculated in term of head pressure or head loss as measured in head feet. Head is the total mechanical energy content of a fluid at a given point in a piping system.
In order for the pump to move the fluid, it needs to product a sufficient pressure differential to overcome head loss in the system. Head loss are created in the piping by friction and by the various valves and fittings.
- 1 PSI system pressure drop equals 2.31 head feet.
- In SI units, head is measured in metre (m).
In English Engineering units (used in the United States), it’s measured in feet (FT).
ค่าต่างของกราฟแสดงสมรรถนะ
Pump Curve Components
A typical pump curve consists of the following components:
กราฟแสดง H-Q
Head-Flow Curve (H-Q Curve)
The head-flow curve (H-Q curve) shows the relationship between the pump’s head and flow rate at a constant rotational speed. The H-Q curve is typically plotted with head on the y-axis and flow rate on the x-axis. The curve shows that as the flow rate increases, the head decreases due to fluid friction and turbulence.
กราฟแสดงการใช้พลังงาน P-Q
Power Curve (P-Q Curve)
The power curve (P-Q curve) shows the relationship between the pump’s power consumption and flow rate at a constant rotational speed. The P-Q curve is typically plotted with power consumption on the y-axis and flow rate on the x-axis. The curve shows that as the flow rate increases, the power consumption increases due to increased fluid friction and turbulence.
กราฟแสดงประสิทธิภาพ E-Q
Efficiency Curve (E-Q Curve)
The efficiency curve (E-Q curve) shows the relationship between the pump’s efficiency and flow rate at a constant rotational speed. The efficiency curve is typically plotted with efficiency on the y-axis and flow rate on the x-axis. The curve shows that as the flow rate increases, the efficiency decreases due to increased fluid friction and turbulence.
Pump Curve Interpretation
Interpreting the pump curve is essential in selecting the right pump for an application and optimizing its performance. Here are some key points to keep in mind when interpreting the pump curve:
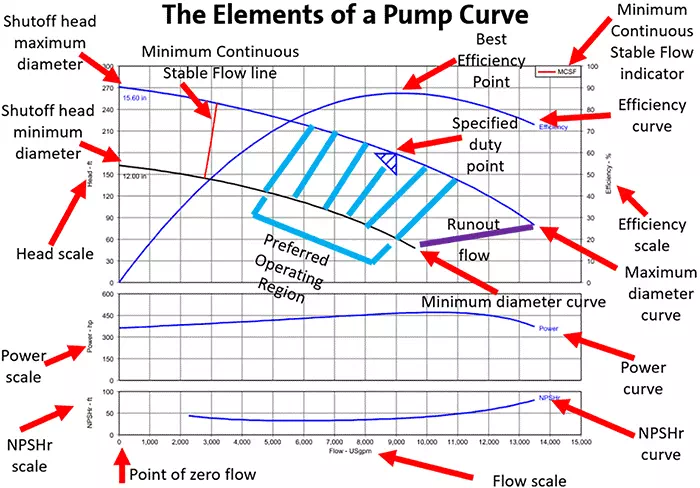
Best Efficiency Point (BEP)
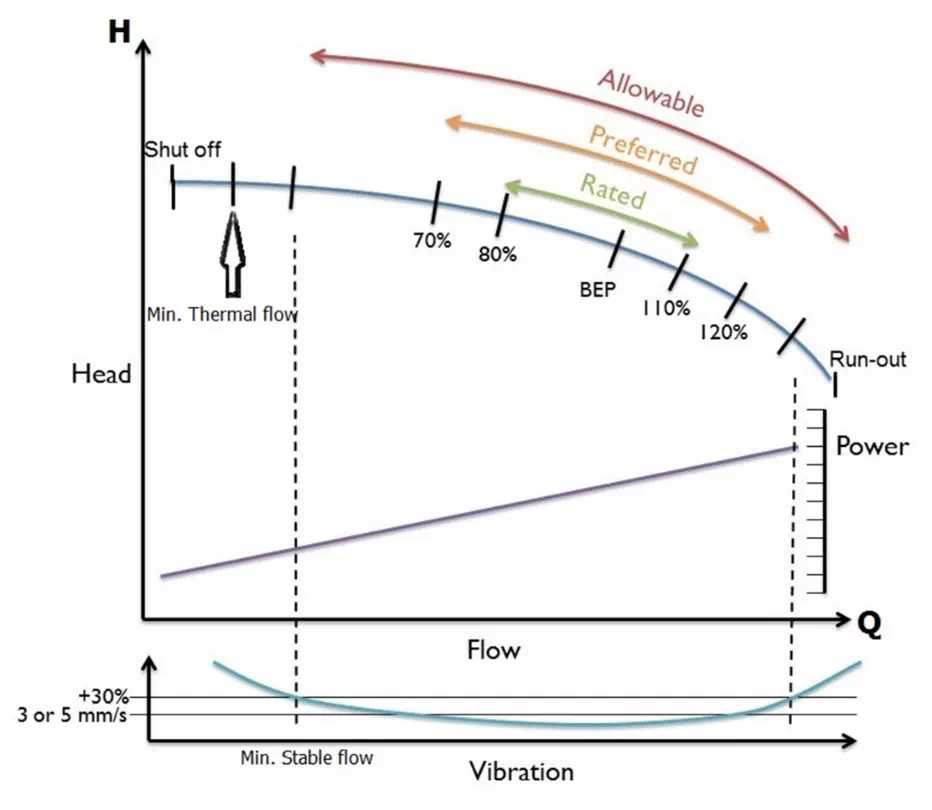
The Best Efficiency Point (BEP) is the point on the H-Q curve where the pump operates at maximum efficiency. The BEP is the most economical operating point and should be targeted when selecting the pump.
How To Find The Best Efficiency Point (BEP)?
As a rule of thumb, the best efficiency point (BEP) is about 85 percent of the shutoff head. It is important to note that the pump should be operated at, or close to, the best efficiency point.
BEP is usually specified in the manual or the pump curve itself. If not, you’ll have to contact the pump manufacturer.
What is ‘Best Efficiency Point?
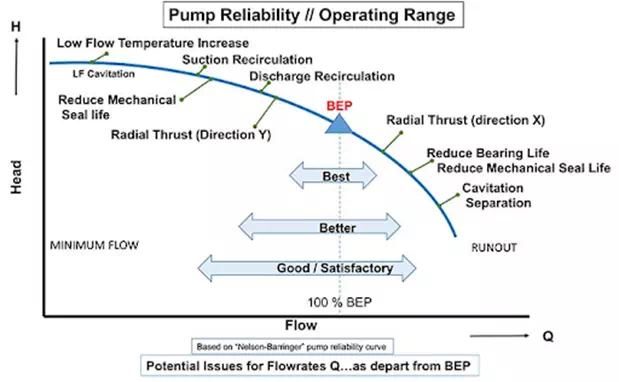
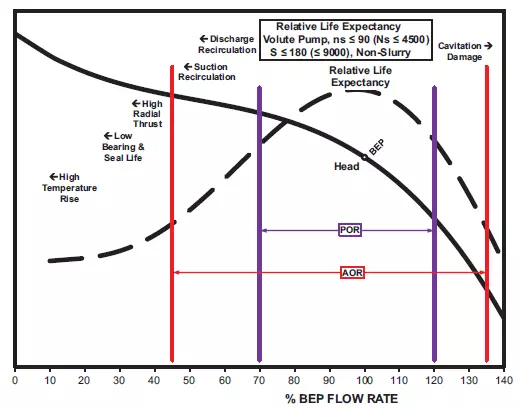
When looking at curves for a new application, there are many factors to consider. But in most cases, a selection should be made as close to the Best Efficiency Point, or BEP, as possible. The BEP is an operating point along the performance curve that shows the highest efficiency point for the impeller diameter of the pump.
Ideally, pumps run at this point for their entire lives. But in real-world applications, system upsets and fluctuating demand cause pumps to operate outside ideal conditions. Here are some common terms you might hear when describing a pump running off its best efficiency point:
- Operating away from BEP - the pump is operating at flows greater than or less than the best efficiency point
- Operating to the right of BEP - operating at a higher flow rate than the best efficiency point
- Operating to the left of BEP - the pump is operating at flows less than the best efficiency point
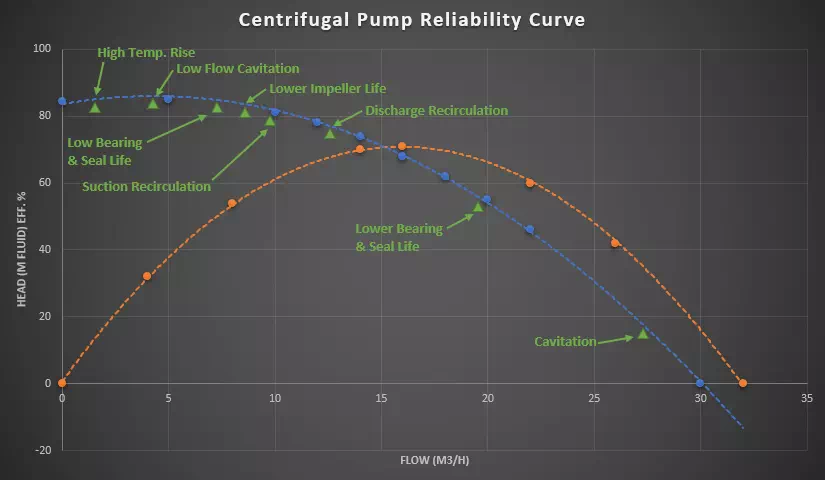
Why does it matter? Running a pump off its best efficiency point, one way or another can add, energy costs, but the biggest consequence of running off the BEP is an increased chance for failure.
Operating the pump to the left or right of BEP means the door is open to challenges like:
- Cavitation
- Excessive vibration, leading to premature wear of seals, shafts, impellers, and bearings
- Increased operating temperature caused by suction or discharge recirculation, vibration, or breakdown of lubricants
- Repeated failures that cost money and time to repair
Now that we understand how a centrifugal pump operates and how to maintain efficiency, let’s review the basics of reading the curve.
This pump curve explanation also discusses variables such as:
- RPM
- Impeller size, as they related to pump performance
- Power
- Efficiency
- Net Positive Suction Head (NPSH) in centrifugal and positive displacement pumps
Operating Range
The operating range is the range of flow rates and heads over which the pump can operate without damaging the impeller or motor. The operating range is limited by the pump’s minimum and maximum flow rates and heads.
Identify the shut-off head and the maximum flow rate of the pump.
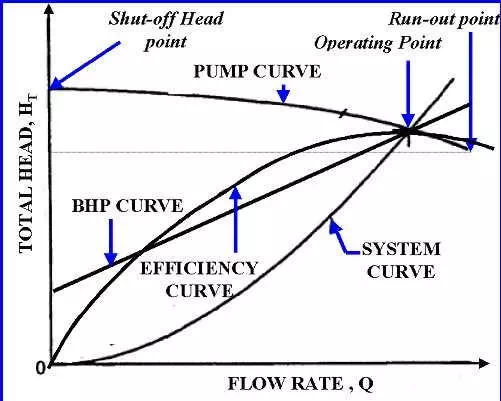
The shut-off head is the maximum head that the pump can generate at zero flow. It is the point where the pump curve intersects the vertical axis of the graph. The maximum flow rate is the maximum flow rate that the pump can deliver at zero head. It is the point where the pump curve intersects the horizontal axis of the graph.
Understand the pump’s efficiency at different flow rates.
The efficiency of the pump varies with the flow rate. The efficiency curve is usually represented on the pump curve graph as a line or a curve. The efficiency curve shows the pump’s efficiency at different flow rates. The efficiency of the pump is usually highest at the BEP and decreases as the flow rate increases or decreases from the BEP.
Net Positive Suction Head (NPSH)
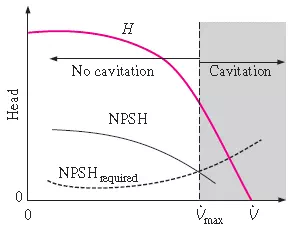
The Net Positive Suction Head (NPSH) is the difference between the fluid’s pressure at the pump suction and the vapor pressure of the fluid. The NPSH is a critical parameter in selecting the pump and should be greater than the pump’s NPSH requirement to prevent cavitation.
Interpreting Pump Curve Shapes
Different pump curve shapes indicate different pump characteristics. The following are the most common pump curve shapes:
Steep Curve
A steep curve indicates that the pump can produce high head at low flow rates. This type of pump is suitable for applications that require high pressure.
Flat Curve
A flat curve indicates that the pump can produce high flow rates at low heads. This type of pump is suitable for applications that require high flow rates.
Steep Drop-Off Curve
A steep drop-off curve indicates that the pump is susceptible to cavitation at low flow rates. This type of pump requires a high NPSH to operate efficiently.
Tips for Pump Curve Analysis
Here are some tips for analyzing pump curves:
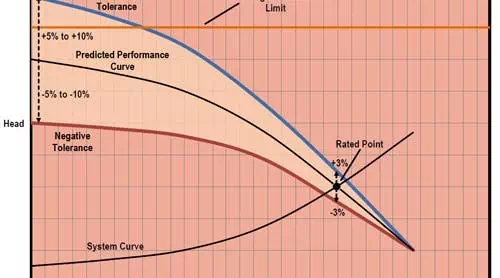
- Always use the pump curve provided by the manufacturer for accurate performance evaluation.
- Consider the system’s friction losses when determining the system curve.
- Ensure that the pump operates at or near its best efficiency point (BEP) to minimize energy consumption and operating costs.
- Avoid operating the pump at low flow rates as it can cause excessive wear and tear on the impeller and reduce the pump’s efficiency.
- Ensure that the required NPSH is available at the pump’s suction to prevent cavitation.
Selecting the Pump
When selecting a pump, the following factors should be considered:
- Flow rate requirement
- Head requirement
- Operating range
- Fluid properties (viscosity, density, temperature, etc.)
- NPSH available
- Efficiency requirement
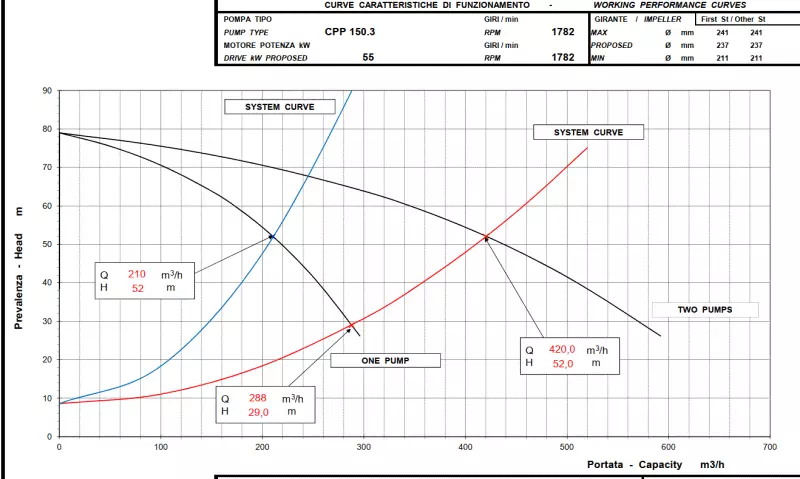
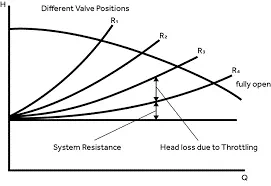
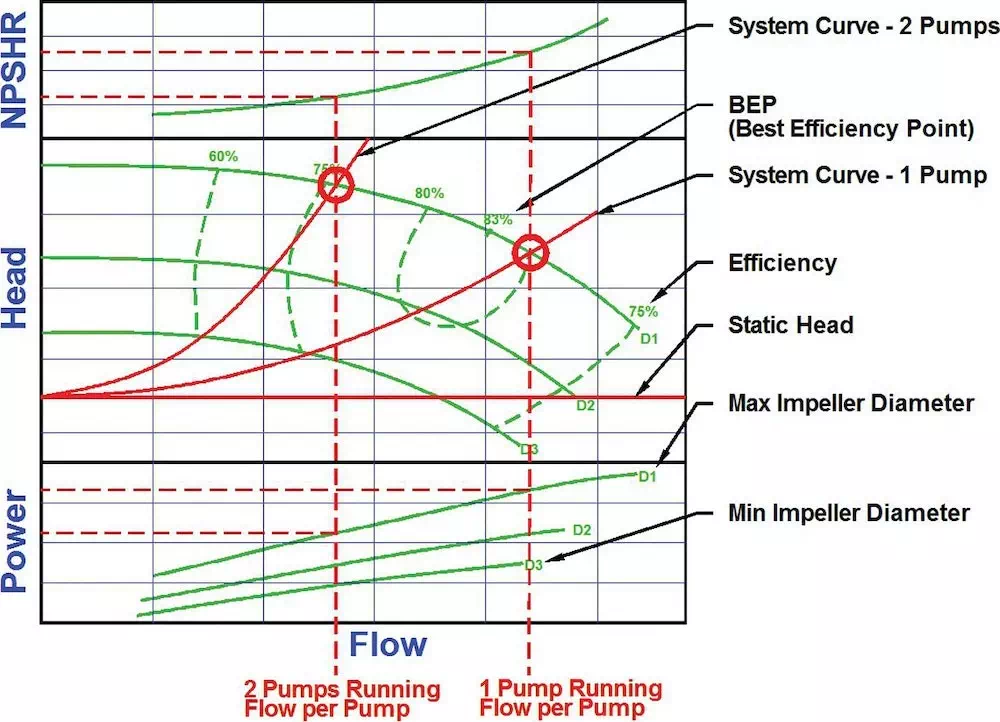
By plotting the system curve (the relationship between the flow rate and head required by the system) on the pump curve, the operating point can be determined. The pump selected should operate at or near the BEP for maximum efficiency and longevity.
Optimizing Pump Performance
To optimize the pump’s performance, the following factors should be considered:
- Operating at or near the BEP for maximum efficiency
- Adjusting the impeller diameter or speed to match the system requirements
- Minimizing fluid friction and turbulence by reducing pipe diameter, increasing pipe roughness, or reducing fluid velocity
- Maintaining the pump and system to prevent wear and damage
Types of Centrifugal Pumps Performance Curves
Explain the centrifugal pump family curve and parameters used in pump selection.
- Head Vs. Flow Curve (H-Q Curve)
- Efficiency Curve
- Power / Energy Curve
- NPSHR curve
- Pump Family Curve
Head Vs. Flow Curve (H-Q Curve)
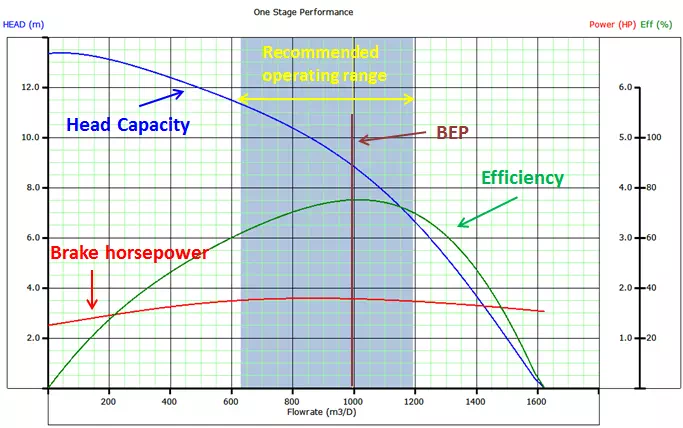
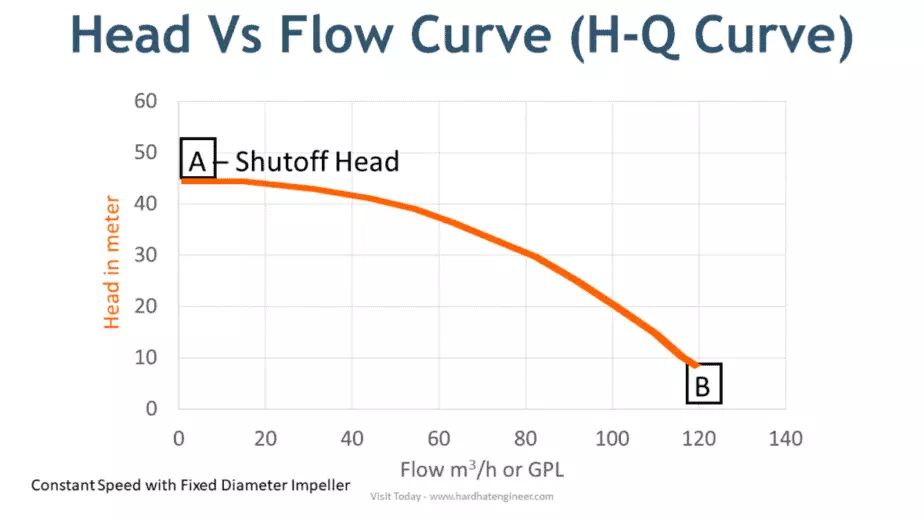
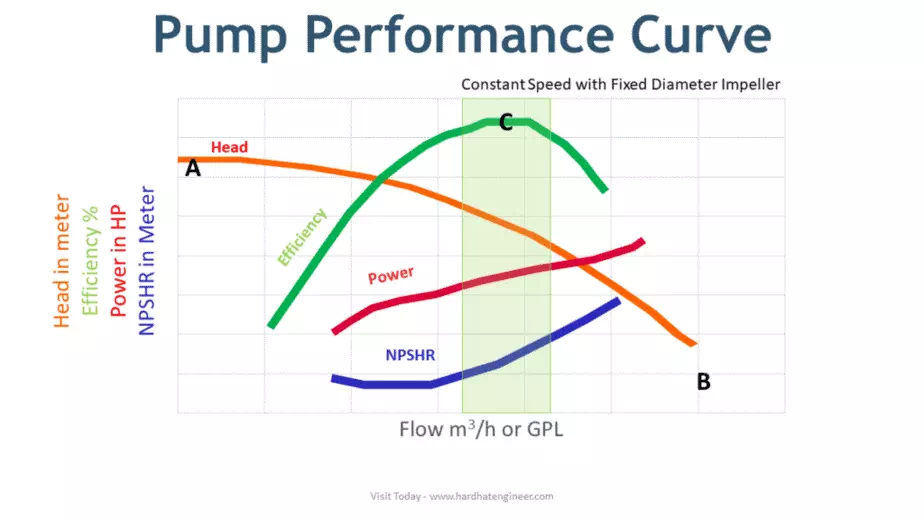
The first curve under pump performance characteristic is the head Vs. flow rate curve. It is also known as a pressure vs. quantity curve. To draw this curve head is plotted on Y-axis, and the flow is plotted on X-axis. You can see the sample HQ curve in the image here.
Now let’s convert this curve to a word so that you can understand the same. The highest point A on Y-axis is called shut-off pressure. It means that this is the highest head available when there is no flow.
Now point B on the X-axis is the highest flow from the pump when there is no head. Let me give you a practical example of this. Consider that you are watering the garden. Point A is when you keep the pipe vertical, and water will go to a certain height before it starts to fall.
Point B is when maximum water comes out of the hose with no pressure head. From point A to Point B, you can see that head will be reduced with an increase in the flow rate. This is all about head vs. flow curve.
Efficiency Curve
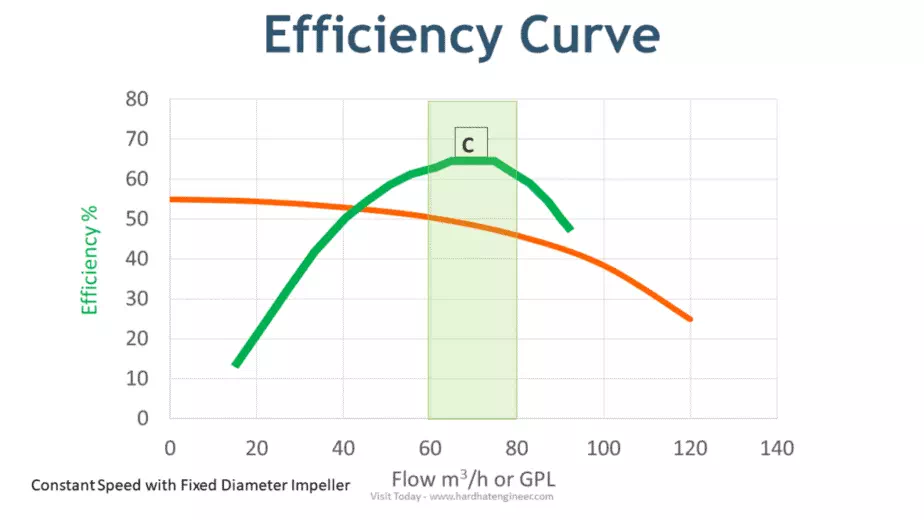
The next pump performance curve is the efficiency curve. All the charts shown here are plotted for a constant speed fixed diameter impeller pump. From this chart, you can see that initially, pump efficiency will increase and reach a maximum and then decrease with increasing flow rate.
To understand this point, let’s continue with our garden hose example. Keep the hose at 45 degrees so that the water will go to the farthest point in the garden. This point is called the best efficiency point – BEP. Here on the chart, it is shown as point C.
Ideally, you should run the Pump within a 10% range from BEP to avoid damage to the pump impeller and seal. When you select the ump, you have to choose flowrate and head within this range.
Power / Energy Curve
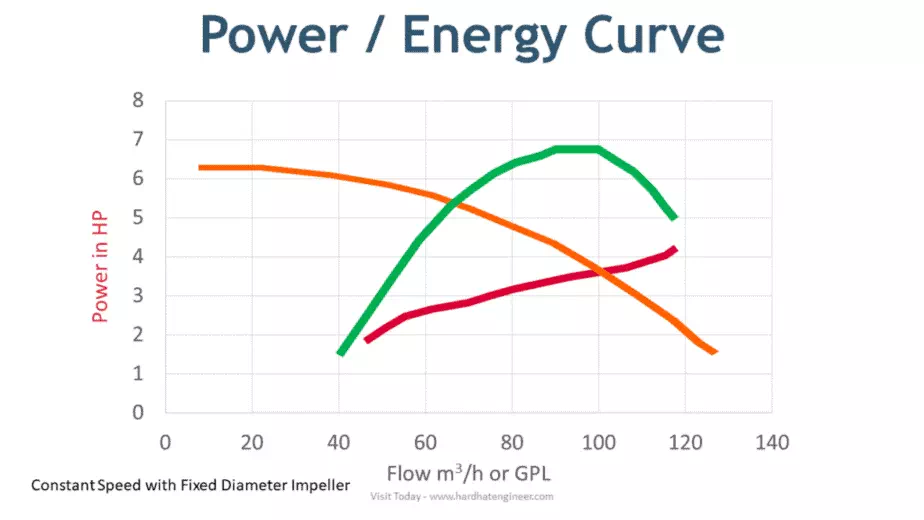
Now the third curve is the power or energy curve. You can also see that with the increase in head and flow rate, power consumption will also increase. This is like when a Pump has to do more work; it needs more power.
You can check the full course available on my website to learn more about the centrifugal pump principle, operation, and design. It is 7 hours long course covering every aspect of the Pump that will make you super confident about a centrifugal pump.
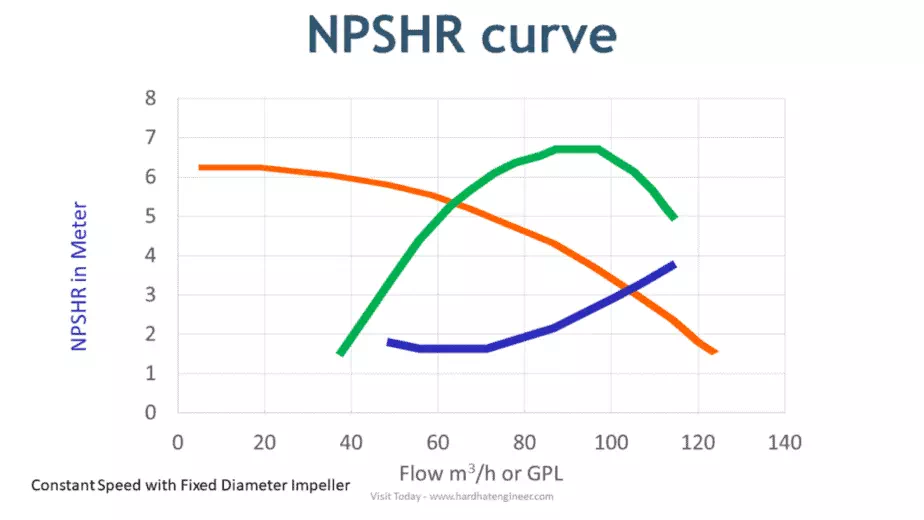
NPSHR Curve
The next curve is the NPSH required curve. Net positive suction head at pump suction is necessary to prevent cavitation in the pump. From the curve, you can see that the NPSH requirement will increase with a higher flow rate.
This is like more liquid with a higher head has to enter the Pump when you push more liquid out.
Centrifugal Pump Performance Curve
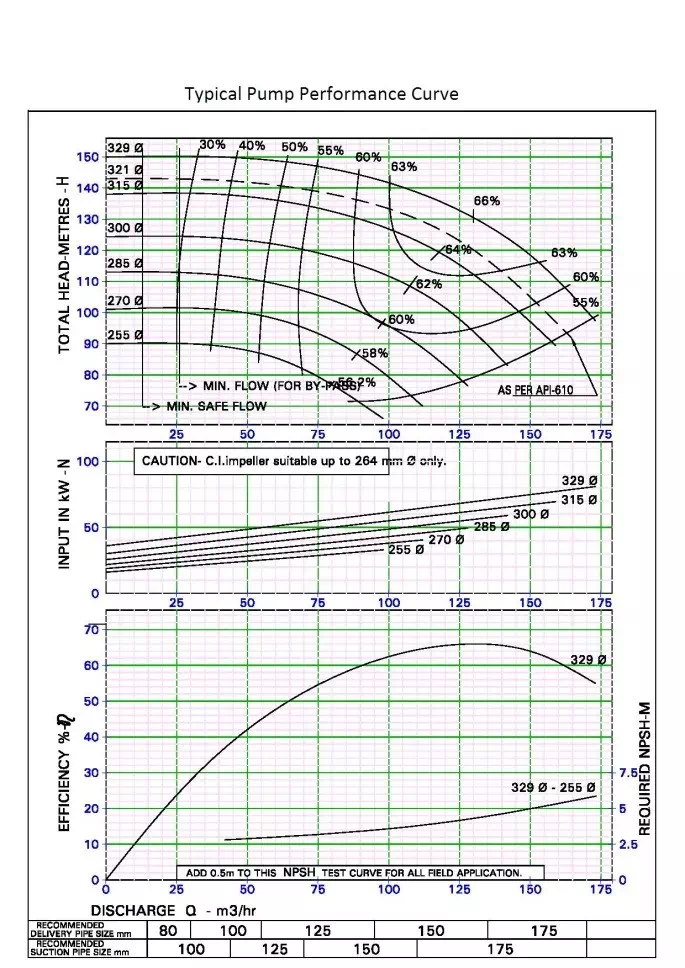
Now let’s put all four curves on a single chart. Here it will give you an overall pump performance review. You can see how these curves interact with each other. As said earlier, all these curves are drawn for a constant speed fixed diameter impeller.
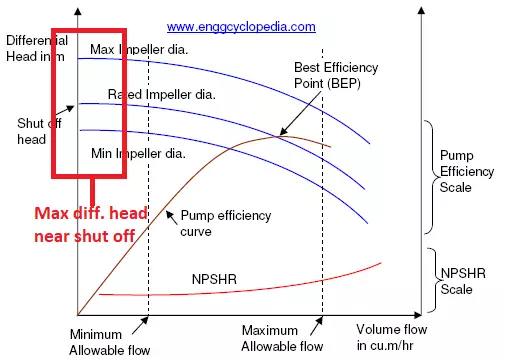
If you change any of these, all the curve parameters will change. So how do you select the Pump? Well, all pump manufacturer develops pump family curve that shows multiple curves on a single chart.
ปัจจัยในการในการเลือกใช้ชนิดของปั๊ม
- คุณสมบัติของของไหล การกัดกร่อน (Corrosion, Chemical type) การเสียดสี (Erosion and abrasion) มีสารแขวนลอยมากน้อยแค่ใหน
- ปริมาณความต้องการการไหล (Flow) ข้อจำกัดของปั๊มแต่ละตัว ใช้แบบคู่ขนาน (Parallel) เพื่อเพิ่มปริมาณความต้องการการไหล ได้หรือไม่
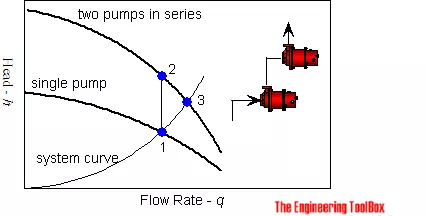
- ความดัน (Pressure) ขาเข้า (Suction) ขาออก (Discharge) ข้อจำกัดของปั๊มแต่ละตัว ใช้ต่อปั๊มแบบอนุกรม (Series) เพื่อเพิ่มความดันได้ (Booster) ได้หรือไม่
- อุณหภูมิ (Temperature) ขาเข้าและขาออกจากปั๊ม มีข้อจำกัดของปั๊มหรือไม่
- ลักษณะของๆไหล มีแก๊ซปนเข้ามา (Gas contaminate) มีสารแขวนลอยเจือปน (Sediment) หรือไม่ ไหลสม่ำเสมอหรือไม่ (Steady flow)
- ความหนืด (Viscosity) ของๆไหล
- ความถ่วงจำเพาะ (Specific gravity) ของๆไหล
- ขนาดของสารแขวนลอย (Sediment, particle)
- การกัดกร่อน (Corrosion)
- ระดับเสียงดัง (Noise) ที่รับได้
- ท่อดูด (Suction) ระดับ ขนาดและความยาวท่อ
- ท่อส่ง (Discharge) ระดับ ขนาดและความยาวท่อ ทนความดันได้
- Dry priming ได้หรือไม่
- NPSH ที่ต้องการ
- การเกิด Cavitation
- ประสิทธิภาพของระบบที่ต้องการ (Efficiency)
- ค่าใช้จ่ายในการใช้งานและบำรุงรักษา (Operation and maintenance cost)
- แหล่งพลังงานที่ขับ (Driver) ที่มีอยู่
- การใช้งานหนักเบา ใช้ไม่ต่อเนื่องนานๆหรือใช้ๆหยุดๆ ใช้กลางแจ้งหรือในร่ม
- การรั่วซึมของปั๊มที่ยอมรับได้
- เดินเครื่องโดยไม่มีของไหลได้หรือใม่ (Run dry)
- ชนิดของมอเตอร์ (Ex-proof or non - ex-proof)
- ความปลอดภัยในการใช้งาน
การเลือกใช้ปั๊มจะต้องกำหนดความดันและปริมาณการไหลที่ต้องการแล้ว จะต้องให้การออกแบบ (Design) ตรงกับมาตรฐานอุตสาหกรรมที่ยอมรับ (Design code and standard เช่น ANSI, API, ISO, JIS, DIN, NFPA เป็นต้น) และคำแนะนำที่ยอมรับในการออกแบบปั๊มอุตสาหกรรม (Industrial practices) ชนิดนั้นๆ
บริษัทไอคิวเอส มีวิศวกรที่มีความชำนาญในการเลือกชนิด (Type) ขนาด (Size) และกำลัง (Rating) ของปั๊มให้เหมาะสมกับงานนั้นๆ โดยได้รับการสนับสนุนด้านเทคนิคจากบริษัทผู้ผลิตปั๊ม สามารถให้คำปรึกษาแก่ลูกค้าได้ตลอดเวลา
บริษัทไอคิวเอสเป็นตัวแทนจำหน่ายปั๊มมากหลายชนิด (Wide range) ครอบคลุมการใช้งาน (Application) ในอุตสาหกรรมเกือบทุกชนิด เช่นปั๊มน้ำ ปั๊มขนส่งน้ำ ปั๊มเอพีไอ ปั๊มน้ำเสีย ปั๊มระบบอาหาร เป็นต้น เป็นปั๊มที่ระดับคุณภาพเป็นที่ยอมรับ มีการใช้งานแพร่หลายในอุตสาหกรรมต่างๆ ทั้งในต่างประเทศและในประเทศไทยเอง สินค้ามีให้เลือกหลายแบบ หลายการใช้งาน หลายแบรนด์ หลายราคา ให้ลูกค้าเลือกใช้ตามความเหมาะสมกับงาน นอกจากนี้บริษัทยังรับผิดชอบในบริการหลังการขายเพื่อให้ลูกค้าสบายใจในการเลือกใช้ปั๊ม
สนใจติดต่อ ขอคำปรึกษา ติดต่อ บ. อินทีเกรทเต็ด ควอลิตี้ เซอร์วิสเซส จำกัด
ภาคผนวก
FAQs
- What is the Best Efficiency Point (BEP) of a centrifugal pump?
The Best Efficiency Point (BEP) is the point on the pump curve where the pump operates at maximum efficiency. It is the point where the pump consumes the least amount of energy while producing the desired flow rate and head.
- What is the operating range of a centrifugal pump?
The operating range is the range of flow rates and heads over which the pump can operate without damaging the impeller or motor.
- What is the Net Positive Suction Head (NPSH)?
The Net Positive Suction Head (NPSH) is the difference between the fluid’s pressure at the pump suction and the vapor pressure of the fluid.
- How can pump performance be optimized?
Pump performance can be optimized by operating at or near the BEP for maximum efficiency, adjusting the impeller diameter or speed to match the system requirements, minimizing fluid friction and turbulence, and maintaining the pump and system.
- Why is understanding pump curves important?
Understanding pump curves is essential in selecting the right pump for an application and optimizing its performance, which can lead to cost savings and improved efficiency.
- How can I use pump curves for pump maintenance?Pump curves can be used for pump maintenance by regularly monitoring the flow rate and head of the pump, plotting the operating point on the pump curve to determine the efficiency of the pump, adjusting the pump speed or impeller diameter to maintain the pump’s efficiency, and inspecting the pump for damage or wear and replacing any damaged components.

